ApiNote guides
Make sense of your beekeeping statistics
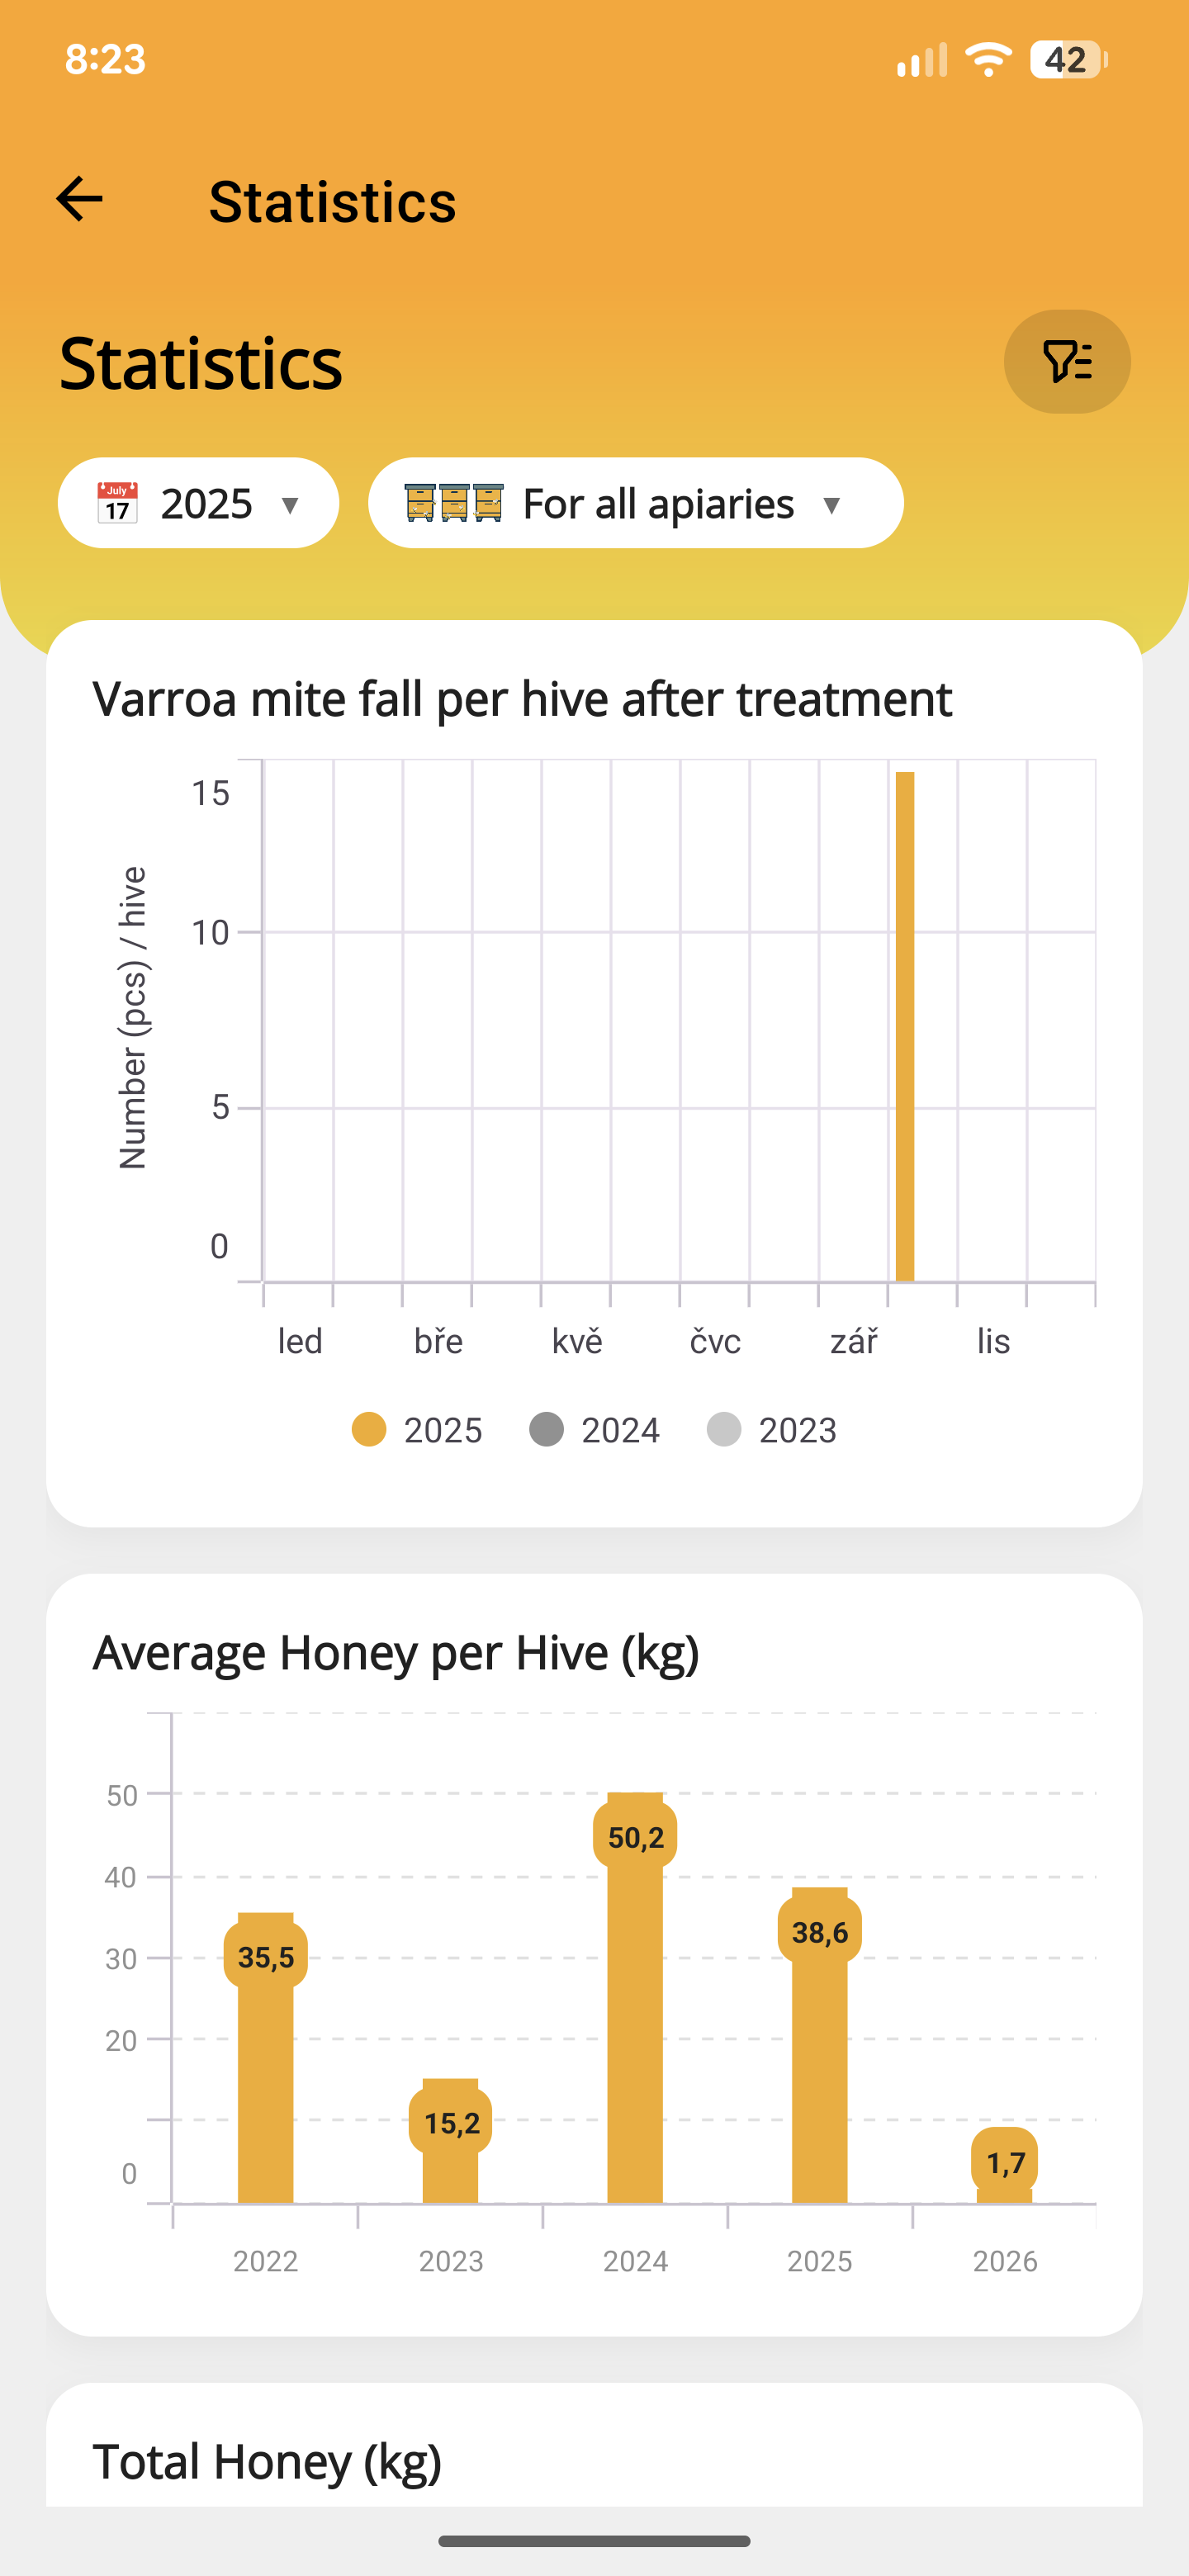
Charts are only as useful as the records behind them. A quieter-looking hive may have produced less honey—or its last harvest may simply be missing from the log.
Begin with one question
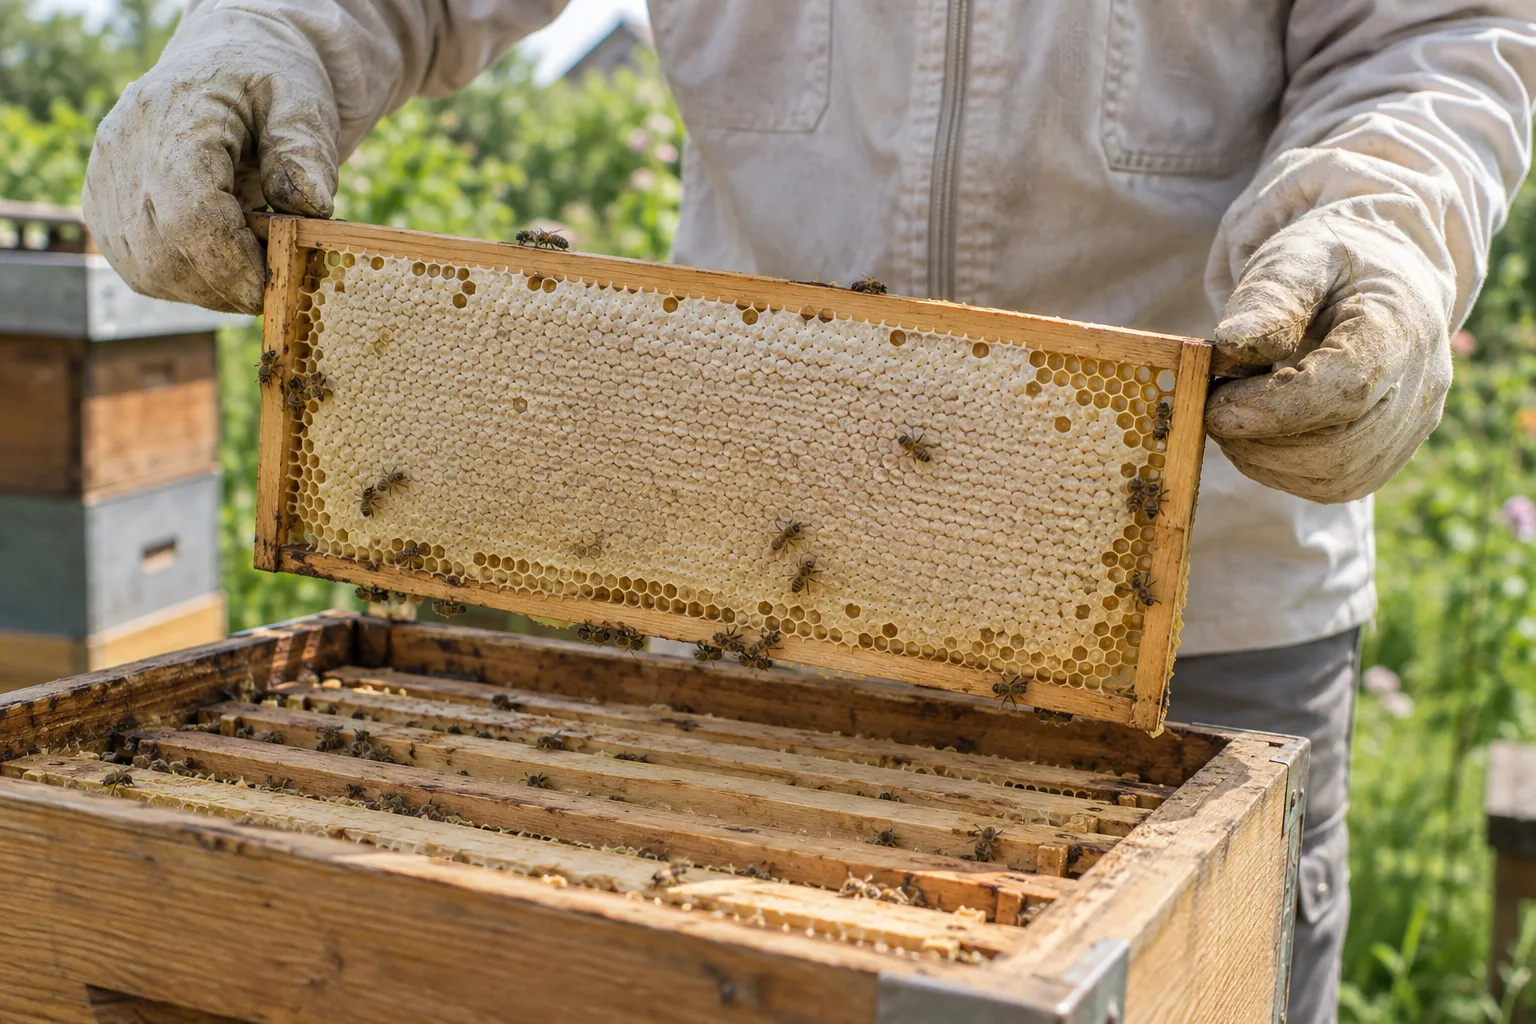
Choose a comparison you can actually act on. Which hives contributed to this year’s harvest? How much feed did one apiary receive? What work happened before a colony changed? Open the relevant statistics and compare them with the individual activity records.
Do not expect a graph to diagnose disease or tell you which treatment works best. A seasonal association is not a controlled experiment.
Check the records before the conclusion
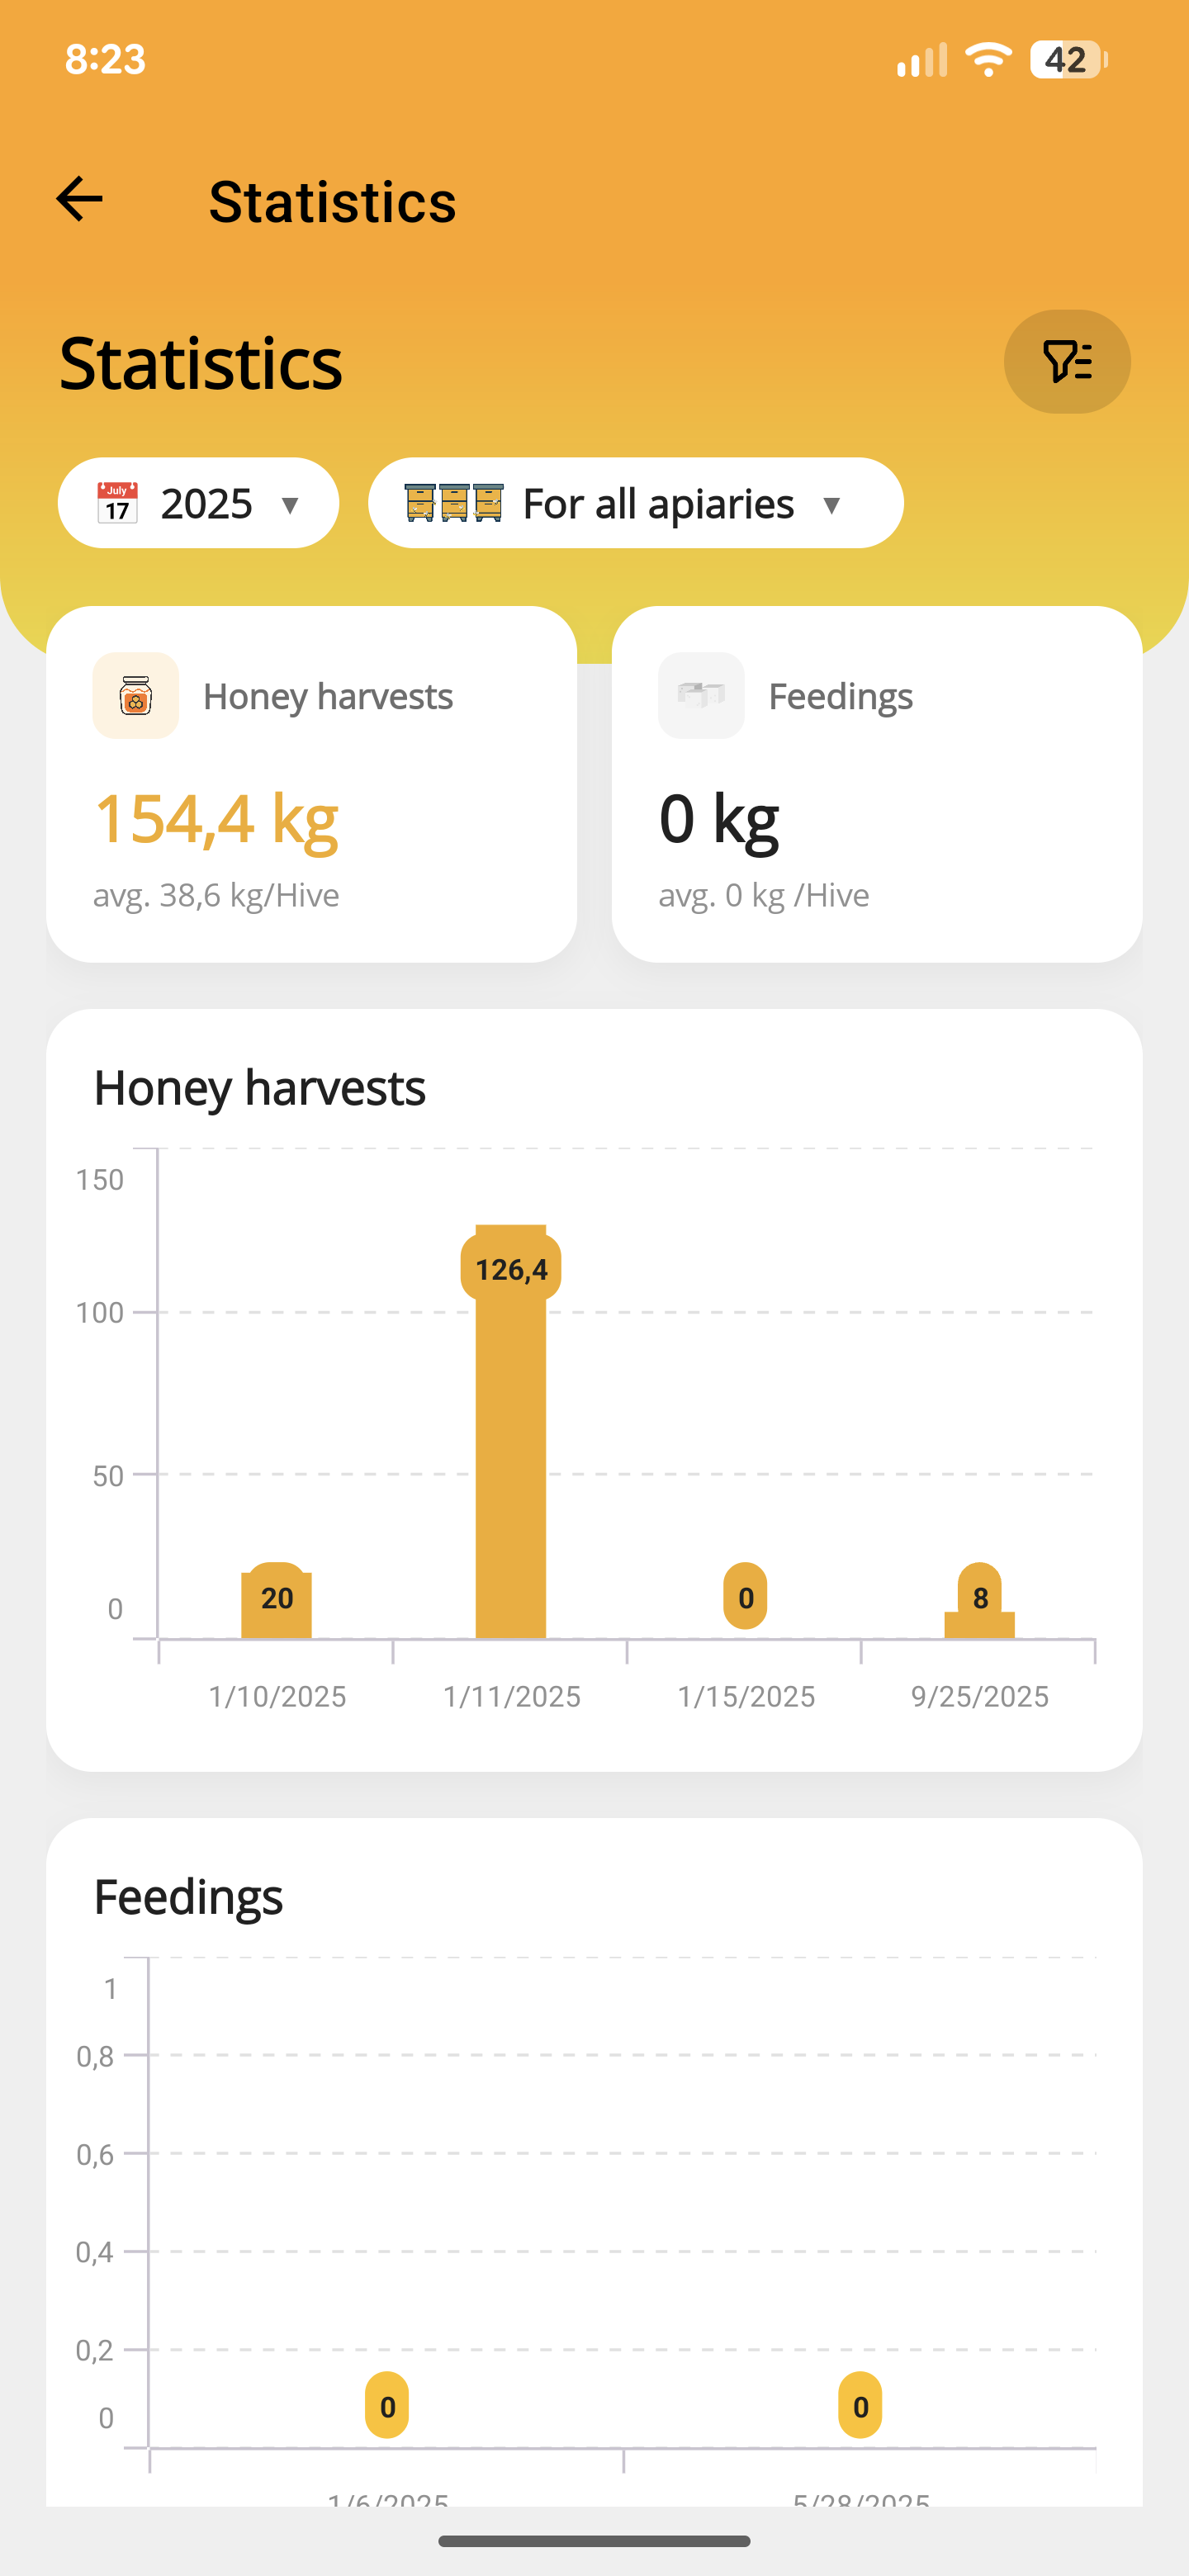
Use consistent quantities and units. Check whether an entry belongs to a hive or to the whole apiary, and whether you logged the same harvest twice. A missing value is not evidence of a zero result.
Compare like with like. A spring split, a full production colony and a recently requeened hive have different starting points. Note moves, queen changes and swarms before ranking colonies.
- Use the same time window for the comparison.
- Check missing entries and duplicate activities.
- Keep colony changes alongside the figures.
- Treat a pattern as a question to investigate, not a proven cause.
Take a copy into your own spreadsheet
ApiNote’s export tools let you select datasets, including records, inspections, queens, treatments, harvests, tasks and finances. Each selected dataset has its own CSV; multiple datasets are packaged as a ZIP.
The export is created on your device and shared to a destination you choose. Store it carefully: names, locations and notes may be personal or sensitive business information. Keep inspection photos separately because they are local attachments, not a promise of a cloud photo archive.
Finish with a short seasonal review
Write down one useful observation and the evidence behind it. For example, a low recorded yield at a moved apiary may justify reviewing forage and timing—not immediately replacing every queen.
A consistent review at the end of a season gives next year’s notes a starting point. The aim is to improve your questions, not manufacture certainty from a tidy graph.
ApiNote · iOS & Android
Good notes make the next visit easier.
Give every colony a history you can find again. ApiNote is available for iOS and Android, free for up to five hives.
Compare Free & ProKeep exploring
Plan a honey harvest without losing the colony’s context
Connect forage, colony strength, harvest readiness and the records behind each crop. A grounded alternative to guaranteed honey-production hacks.
Updated
Keep a useful record of weather and forage
Track bloom dates, weather interruptions and colony observations at your apiary. Build a local seasonal record without confusing forecasts with field evidence.
Updated
What to record in a beekeeping logbook
A practical hive record checklist: inspections, queens, feeding, treatments, mite counts and harvests, with clear next actions for your next apiary visit.
Updated